The most expensive mistakes in tech come from people who don't see the whole. They fix the symptom in front of them and accidentally make the system worse. You can tell who they are because their wins are thin and their fires come back.
Systems thinking is the opposite. You learn to see the parts, how they interact, and the loops that make results compound or cancel.
The Amazon Flywheel
In 2001, Amazon was not inevitable. Margins were thin, the dot-com crash had just hit, and the company looked fragile. Jeff Bezos and a small group drew a simple diagram that later got called the flywheel.
Lower prices lead to more customers. More customers attract more third-party sellers. More sellers increase selection. Better selection improves customer experience. Better experience drives more traffic. More traffic grows volume, which lowers unit costs, which lets you lower prices again.
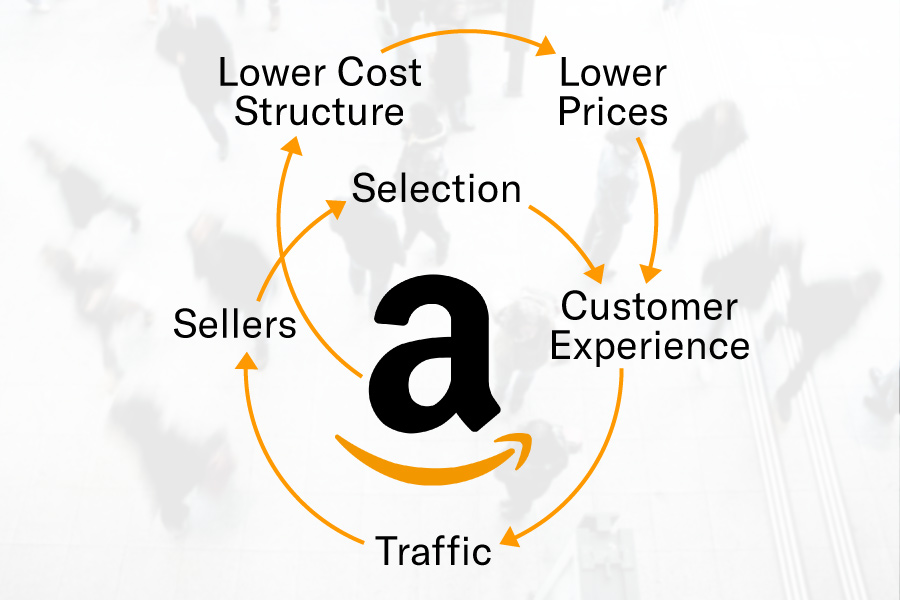
A few boxes, a few arrows, and a promise that if you push anywhere on that circle, the whole thing spins faster.
Most retail executives at the time optimized locally. Negotiate a better supplier discount this quarter. Cut support headcount. Raise shipping fees. Every move had a clear short-term metric and a hidden long-term cost.
Amazon did the opposite. They launched Marketplace even though it would compete with their own retail margins, because more sellers thickened the selection node. They launched Prime even though it looked crazy to pre-commit to fast shipping, because reducing friction strengthened the experience node and raised repeat purchase frequency, which increased throughput, which reduced per-unit shipping costs, which justified Prime in the first place.
The diagram was not a slogan. It was a map for every decision.
The Andon Cord
A second story, shorter but just as useful.
Taiichi Ohno at Toyota put an andon cord on the assembly line. Any worker could stop the line if they saw a defect. Western managers visiting were horrified. Stopping the line kills throughput.

Ohno knew the opposite was true. If you let defects flow, you pay the tax forever. If you stop and fix the cause, you reduce variation at the source, which raises quality, which reduces rework, which shortens cycle time, which raises morale, which increases suggestions, which reduces future defects again.
It looks slower in the moment and faster over the year. The cord was a physical commitment to attack causes, not symptoms.
The Pattern
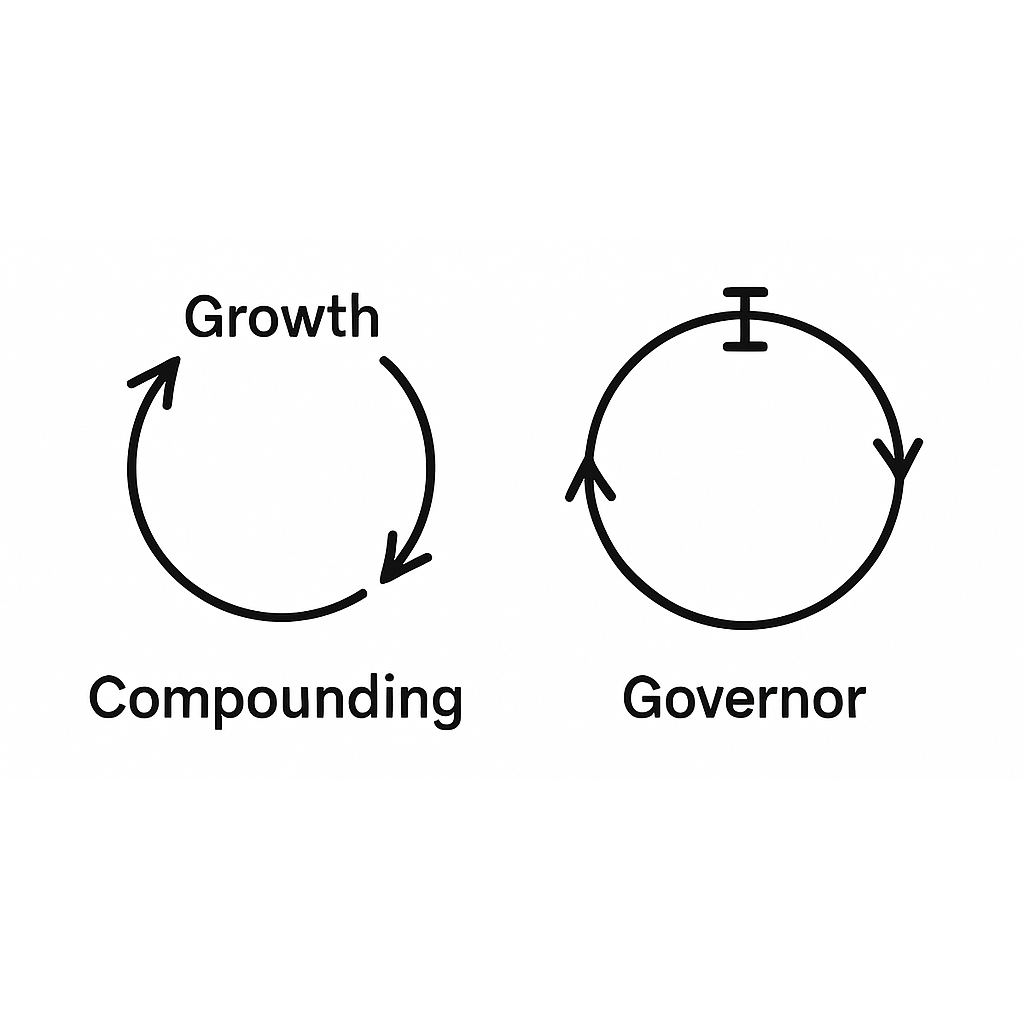
Both stories share the same pattern. Name the loops. Make them visible. Strengthen the reinforcing ones and remove friction. Add balancing loops that prevent blowups. Keep going even when a dashboard says you're down this week.
You can tell whether a team sees the whole by how they talk. Symptom thinkers talk in tasks: "Ship dark mode." "Cut CAC." "Add an LLM wrapper."
System thinkers talk in mechanisms: "Reduce time to habit formation." "Increase network density among creators in week one." "Shorten the model improvement loop from 30 days to 7."
Same work, different altitude.
The Failure Modes
The common failure modes are predictable.
Local optimization is the big one. You speed up one step and slow the line. You make activation look better by adding incentives that attract the wrong users who churn and tank NPS and raise support load.
Lag blindness is another. You push a change and expect instant payoff even though the loop you touched has a 90-day delay. If you don't measure at the right horizon, you'll revert to the old behavior that felt faster and was actually slower.
The Tests
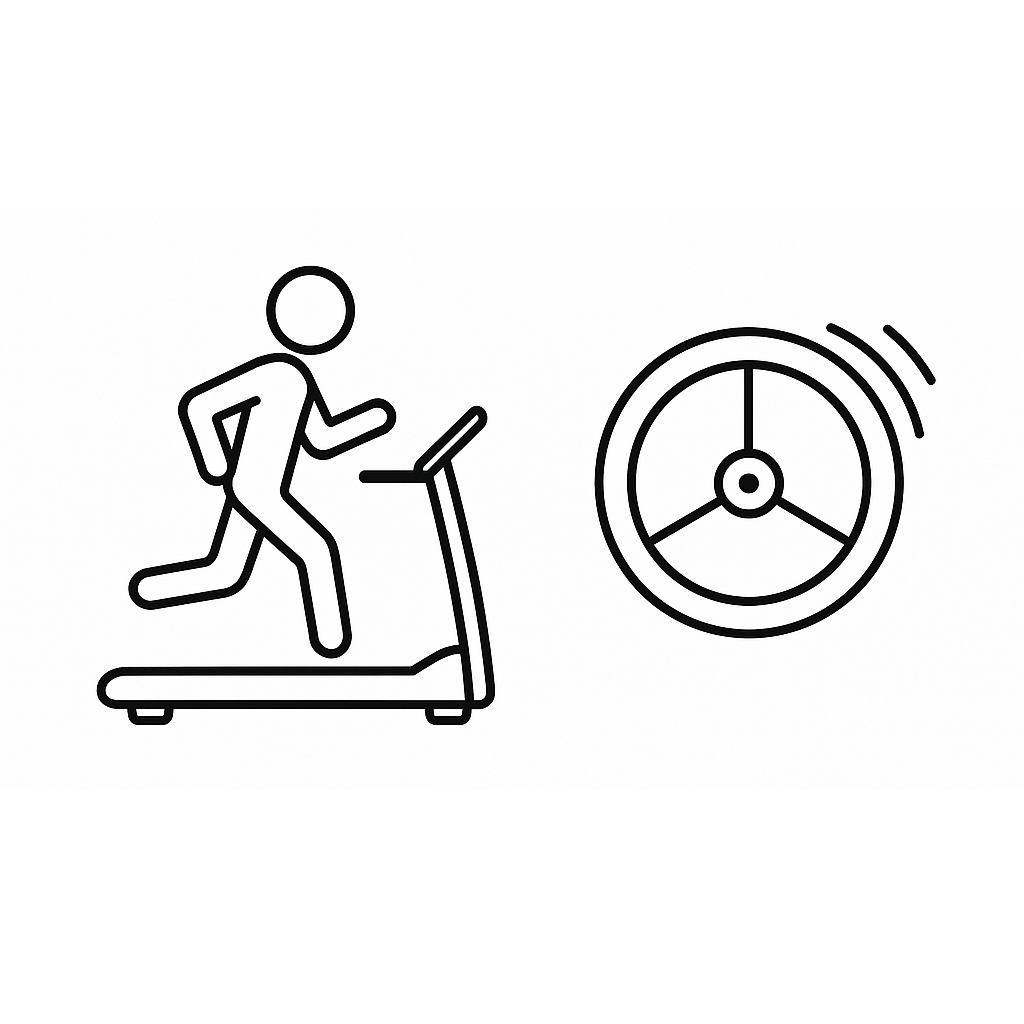
Here's a practical test: if you vanished for a month, would your system keep compounding or decay?
If the answer depends on you pushing every day, you built a treadmill, not a flywheel. It's powered by willpower rather than structure.
The fix is to move effort from rowing to designing the current. Codify the onboarding, automate the review cycle, create a weekly habit that surfaces real anomalies, design incentives so people do the right thing by default.
Another test: can you explain your product's compounding in one paragraph? Not a pitch. A description of how X leads to Y leads to Z, and which part you're strengthening this quarter. If you can't, you're probably copying features from neighbors and calling it strategy.
The Action
Bezos wasn't a wizard. He chose a model that compounding could power, then pruned everything that didn't feed the loops. Ohno wasn't romantic. He chose to eat small pain now to avoid big pain forever.
You can do the same, even at an early-stage startup. Map your loops. Reduce delay. Remove friction at the highest-leverage arrows. Install one or two balancing loops to keep the graph from exploding.
If you want one action: bring your team into a room, draw five boxes and arrows, and mark the single arrow whose coefficient, if doubled, would most increase monthly compounding. Commit two sprints to doubling it. Ship only things that touch that arrow. After those sprints, redraw the system.
If the diagram doesn't change, you shipped theater.
The Slope
The people who don't see the whole will always look faster at first. They have clean dashboards and short demos. They also keep stepping on the same rakes.
The people who see the whole look slower at the start because they're setting joints, not painting walls. Then the curve bends. If you stay with the loops long enough, the work starts helping you back.
That's what systems thinking buys you. Not a clever diagram. A slope.